3 min readLongevity & Biological Age
I calculated my death-risk from 9 blood markers — here’s the formula
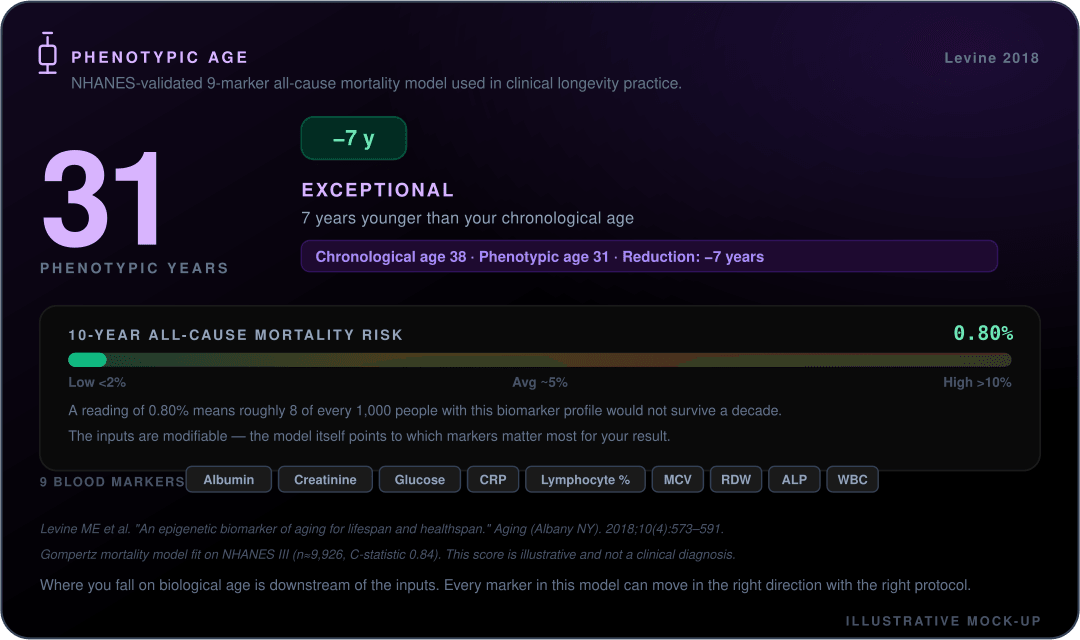
Nine markers on an ordinary blood panel can be combined into a "phenotypic age" that predicts mortality better than the candles on your birthday cake. Here is what each one is, and how the PhenoAge formula turns them into a number.
Part 2 of 23This article is part of the Longevity & Biological Age guideYour birth certificate says one age. Your blood may say another. In 2018 a team led by Morgan Levine published a formula — PhenoAge — that takes nine markers from an ordinary blood panel and combines them into a "phenotypic age": the age at which your biology is actually operating. It predicts all-cause mortality better than the number of candles on your cake. Here is exactly which nine markers go in, and how they become a single, sobering, and trainable number. (For the bigger-picture case, see our PhenoAge explainer.)
Why nine ordinary markers beat your calendar age
Levine and colleagues (2018, Aging) built PhenoAge by finding the combination of routine markers that best predicted mortality in large US survey data, then validated it elsewhere. The insight is that ageing shows up across multiple systems at once — inflammation, metabolism, immune function, organ health — and no single marker captures it, but nine together do a remarkably good job. Two people of the same chronological age can have phenotypic ages a decade apart, and it is the phenotypic age that tracks their actual risk.
The nine markers, and what each represents
Here is the full input list. Albumin (liver/nutritional status). Creatinine (kidney function). Glucose (metabolic health). C-reactive protein (systemic inflammation — the single heaviest-weighted input). Lymphocyte percentage (immune profile). Mean cell volume, or MCV (red blood cell size). Red cell distribution width, or RDW (variation in red cell size, a quiet but powerful ageing signal). Alkaline phosphatase (liver and bone). And white blood cell count (immune/inflammatory load). Plus your chronological age, which anchors the calculation. Every one of these appears on a standard CBC and metabolic panel — nothing exotic required.
How the formula actually works (without the algebra)
The maths is a weighted sum, not a simple average. Each of the nine markers is multiplied by a coefficient from the original regression — CRP and RDW carry heavy weight, others less — and combined with chronological age to produce a mortality risk score. That score is then converted, through a mortality model, into an equivalent age: the phenotypic age at which that level of risk is average in the population. You do not need to do the algebra by hand; the point is that the weights are fixed and published, so the calculation is objective and reproducible, not a wellness guess.
The good news: the inputs are trainable
What makes PhenoAge genuinely useful rather than merely fascinating is that its heaviest inputs respond to the things you control. CRP falls with lost visceral fat, exercise, better sleep and an anti-inflammatory diet. Glucose responds to carbohydrate quality and weight loss. Even the blood-count markers shift with overall health. So a phenotypic age older than your calendar age is not a verdict — it is a to-do list. Re-test in a few months and you can watch it move.
How Misi runs the calculation for you
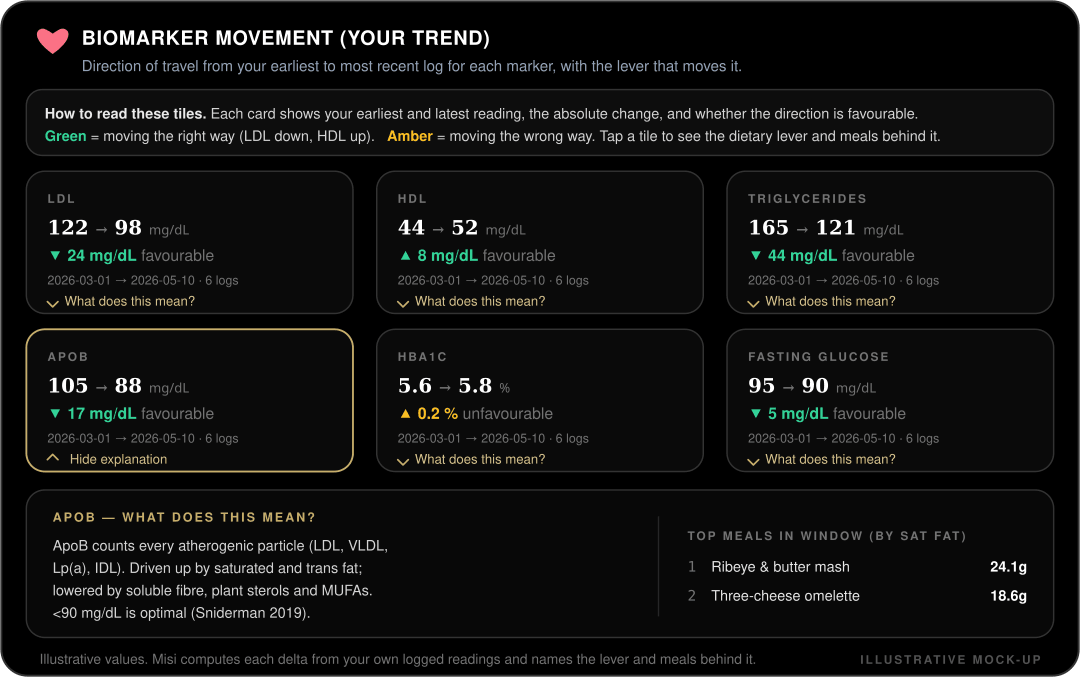
Upload a standard blood panel and Misi extracts the nine markers automatically, applies the published Levine coefficients, and returns your phenotypic age alongside your chronological age — no manual data entry, no spreadsheet. It then tracks the result across tests and folds it into your composite longevity score, so the abstract "death-risk formula" becomes a concrete number you can work to lower quarter by quarter.
PhenoAge turns nine ordinary blood markers into the age your body is really operating at. The number can be older than your birthday says — and, unlike your birthday, you can make it go the other way.
This is general educational information, not medical advice or a diagnostic tool. PhenoAge is a research-derived estimate, not a clinical diagnosis. Discuss any abnormal markers with your doctor, who can interpret them in the context of your full health picture.
Ready to put this into practice?
Misi BioLabs turns your bloods into a meal plan, training block and AI coaching — in one place.
Start freeFree tools
- PhenoAge Calculator — Biological age from a standard blood panel (Levine 2018).
- Biological Age Calculator — How fast are you really ageing? Nine blood markers answer it — no quiz.
- VO2max Calculator — Cooper 12-minute test → VO2max + fitness age + mortality hazard.